Loop Data Box Score
The post-race loop data for the 2020 Toyota 200 at Darlington Raceway includes in-depth driver stats, average speeds, and key performance metrics from the NASCAR XFINITY Series race.
Toyota 200
Thursday, May 21st, 2020
Darlington Raceway, Darlington, SC
-
28

-
9

-
2

- Positions 1 - 12: The first 12 NXS Teams based on the Adverse Conditions Line Up Eligibility will be assigned starting positions 1st – 12th using a random draw.
- Positions 12 – 24: The next 12 NXS Teams based on the Adverse Conditions Line Up eligibility will be assigned starting positions 12th- 24th using a random draw.
- Starting positions 25 – 36: The next 12 NXS Teams based on the Adverse Conditions Line Up eligibility will be assigned starting positions 25th -36th using a random draw.
- Any vehicles that are eligible for the Event in position 37th – 40th will be assigned starting positions based on their order of eligibility.
- Drivers Entered: 39 (1 drivers will not make the race)
- Laps Scheduled: 147
- Margin of Victory: 0.086 Seconds
- Time of Race: 1 Hours 44 Minutes 26 Seconds
- Average Speed: 115.367
- Cautions: 5 for 58 laps
- Lead Changes: 11
- Green Flag Passes: 622 (7.0 passes per green flag lap)
- Darlington Raceway
- Toyota 200
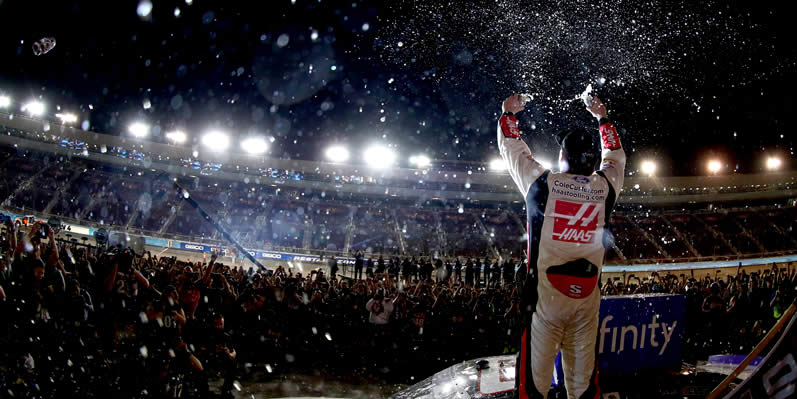
- Race Winner: Chase Briscoe
- Age: 25
- Team : No. 98 - HighPoint.com Ford
- Owner: Stewart-Haas Racing
- Crew Chief: Richard Boswell, II
- Chase Briscoe won the Toyota 200, his fourth victory in 55 NASCAR Xfinity Series races.
- This is his second victory and fourth top-10 finish in 2020.
- This is his first victory and second top-10 finish in two races at Darlington Raceway.
- Kyle Busch (second) posted his eighth top-10 finish in 12 races at Darlington Raceway. It is his second top-10 finish in 2020.
- Justin Allgaier (third) posted his seventh top-10 finish in ten races at Darlington Raceway.
- Harrison Burton (ninth) was the highest finishing rookie.
Want to know more about Loop Data?: I've put together a complete resource for NASCAR Loop Data insights and show how loop data can help you in fantasy, DFS and wagering.
| DRIVER | ST | MID | CLO | FIN | HI | LOW | ARP | PL DIF | GFP | GFxP | PD | QPS | % QPS | FST | % T15 | LED | % LED | LAPS | DR | TOT PTS |
|---|---|---|---|---|---|---|---|---|---|---|---|---|---|---|---|---|---|---|---|---|
| Chase Briscoe | 11 | 5 | 2 | 1 | 1 | 31 | 5.0 | 10 | 24 | 17 | 7 | 24 | 100.00 | 15 | 96.6 | 45 | 30.6 | 147 | 130.60 | 50 |
| Kyle Busch | 26 | 1 | 5 | 2 | 1 | 26 | 5.8 | 24 | 45 | 10 | 35 | 35 | 77.78 | 37 | 93.9 | 45 | 30.6 | 147 | 127.70 | 0 |
| Justin Allgaier | 10 | 2 | 1 | 3 | 1 | 25 | 3.8 | 7 | 17 | 12 | 5 | 17 | 100.00 | 17 | 99.3 | 9 | 6.1 | 147 | 121.30 | 48 |
| Austin Cindric | 7 | 8 | 4 | 4 | 3 | 29 | 6.4 | 3 | 19 | 19 | 0 | 19 | 100.00 | 2 | 98.0 | 0 | 0.0 | 147 | 106.80 | 42 |
| Noah Gragson | 1 | 3 | 6 | 5 | 1 | 28 | 3.0 | -4 | 11 | 16 | -5 | 10 | 90.91 | 14 | 99.3 | 46 | 31.3 | 147 | 127.00 | 50 |
| Daniel Hemric | 23 | 6 | 3 | 6 | 2 | 27 | 6.8 | 17 | 28 | 14 | 14 | 21 | 75.00 | 4 | 95.9 | 0 | 0.0 | 147 | 102.80 | 40 |
| Ryan Sieg | 4 | 9 | 9 | 7 | 2 | 27 | 8.0 | -3 | 16 | 17 | -1 | 16 | 100.00 | 5 | 97.3 | 0 | 0.0 | 147 | 98.40 | 40 |
| Ross Chastain | 9 | 4 | 7 | 8 | 1 | 16 | 5.3 | 1 | 22 | 21 | 1 | 21 | 95.45 | 3 | 99.3 | 1 | 0.7 | 147 | 106.60 | 42 |
| Harrison Burton | 12 | 10 | 8 | 9 | 6 | 24 | 10.7 | 3 | 9 | 14 | -5 | 9 | 100.00 | 0 | 97.3 | 0 | 0.0 | 147 | 90.80 | 28 |
| Justin Haley | 3 | 12 | 10 | 10 | 1 | 19 | 9.9 | -7 | 16 | 18 | -2 | 14 | 87.50 | 0 | 99.3 | 0 | 0.0 | 147 | 89.50 | 28 |
| Brett Moffitt | 22 | 14 | 11 | 11 | 7 | 26 | 13.9 | 11 | 20 | 19 | 1 | 12 | 60.00 | 0 | 81.0 | 0 | 0.0 | 147 | 83.80 | 0 |
| Jeremy Clements | 30 | 11 | 14 | 12 | 4 | 30 | 12.3 | 18 | 24 | 16 | 8 | 13 | 54.17 | 0 | 93.2 | 0 | 0.0 | 147 | 85.30 | 26 |
| Brandon Brown | 6 | 15 | 15 | 13 | 1 | 27 | 14.0 | -7 | 19 | 23 | -4 | 16 | 84.21 | 0 | 81.6 | 1 | 0.7 | 147 | 80.70 | 24 |
| Anthony Alfredo | 17 | 17 | 18 | 14 | 8 | 26 | 16.9 | 3 | 16 | 21 | -5 | 5 | 31.25 | 1 | 11.6 | 0 | 0.0 | 147 | 76.20 | 23 |
| BJ McLeod | 13 | 22 | 17 | 15 | 2 | 31 | 21.2 | -2 | 32 | 10 | 22 | 3 | 9.38 | 0 | 9.5 | 0 | 0.0 | 147 | 68.50 | 22 |
| Josh Williams | 15 | 21 | 16 | 16 | 13 | 31 | 18.8 | -1 | 19 | 20 | -1 | 2 | 10.53 | 0 | 21.1 | 0 | 0.0 | 147 | 70.50 | 21 |
| Alex Labbe | 16 | 18 | 19 | 17 | 4 | 30 | 18.9 | -1 | 16 | 20 | -4 | 0 | 0.00 | 1 | 2.0 | 0 | 0.0 | 147 | 69.80 | 20 |
| Riley Herbst | 5 | 13 | 13 | 18 | 1 | 18 | 11.8 | -13 | 9 | 19 | -10 | 9 | 100.00 | 0 | 96.6 | 0 | 0.0 | 147 | 78.00 | 19 |
| Joe Graf Jr | 36 | 27 | 22 | 19 | 7 | 36 | 25.4 | 17 | 13 | 14 | -1 | 0 | 0.00 | 0 | 0.7 | 0 | 0.0 | 147 | 55.00 | 18 |
| Brandon Jones | 8 | 16 | 21 | 20 | 1 | 30 | 18.1 | -12 | 25 | 43 | -18 | 7 | 28.00 | 4 | 21.1 | 0 | 0.0 | 147 | 74.00 | 17 |
| Ray Black II | 19 | 19 | 20 | 21 | 1 | 30 | 20.1 | -2 | 14 | 22 | -8 | 0 | 0.00 | 0 | 3.4 | 0 | 0.0 | 147 | 64.20 | 16 |
| Timmy Hill | 28 | 23 | 23 | 22 | 8 | 32 | 22.3 | 6 | 38 | 19 | 19 | 0 | 0.00 | 1 | 1.4 | 0 | 0.0 | 147 | 61.80 | 0 |
| Jeffrey Earnhardt | 34 | 25 | 24 | 23 | 4 | 34 | 23.8 | 11 | 16 | 17 | -1 | 0 | 0.00 | 0 | 2.0 | 0 | 0.0 | 147 | 53.20 | 14 |
| Chad Finchum | 24 | 24 | 25 | 24 | 5 | 30 | 22.3 | 0 | 12 | 16 | -4 | 0 | 0.00 | 0 | 1.4 | 0 | 0.0 | 147 | 57.70 | 13 |
| Michael Annett | 2 | 7 | 12 | 25 | 2 | 32 | 10.1 | -23 | 15 | 15 | 0 | 13 | 86.67 | 8 | 86.4 | 0 | 0.0 | 146 | 85.90 | 20 |
| Tommy Joe Martins | 25 | 26 | 26 | 26 | 3 | 34 | 26.9 | -1 | 22 | 8 | 14 | 0 | 0.00 | 0 | 1.4 | 0 | 0.0 | 146 | 51.30 | 11 |
| Colby Howard | 31 | 30 | 28 | 27 | 6 | 38 | 30.1 | 4 | 15 | 7 | 8 | 0 | 0.00 | 0 | 1.4 | 0 | 0.0 | 146 | 39.80 | 10 |
| Joe Nemechek | 29 | 28 | 27 | 28 | 8 | 32 | 27.2 | 1 | 8 | 16 | -8 | 0 | 0.00 | 0 | 0.7 | 0 | 0.0 | 145 | 45.70 | 0 |
| Vinnie Miller | 20 | 32 | 29 | 29 | 5 | 32 | 29.1 | -9 | 8 | 16 | -8 | 0 | 0.00 | 0 | 1.4 | 0 | 0.0 | 145 | 40.70 | 8 |
| Mason Massey | 33 | 31 | 30 | 30 | 19 | 36 | 30.9 | 3 | 14 | 21 | -7 | 0 | 0.00 | 0 | 0.0 | 0 | 0.0 | 143 | 37.20 | 7 |
| Ronnie Bassett Jr | 32 | 35 | 31 | 31 | 30 | 38 | 34.7 | 1 | 6 | 9 | -3 | 0 | 0.00 | 0 | 0.0 | 0 | 0.0 | 143 | 32.00 | 6 |
| Kody Vanderwal | 21 | 34 | 32 | 32 | 21 | 36 | 33.9 | -11 | 6 | 8 | -2 | 0 | 0.00 | 0 | 0.0 | 0 | 0.0 | 142 | 32.30 | 5 |
| Bayley Currey | 35 | 33 | 33 | 33 | 13 | 35 | 31.8 | 2 | 7 | 13 | -6 | 0 | 0.00 | 4 | 0.7 | 0 | 0.0 | 142 | 36.20 | 0 |
| Matt Mills | 27 | 29 | 35 | 34 | 6 | 35 | 30.7 | -7 | 10 | 16 | -6 | 0 | 0.00 | 0 | 0.7 | 0 | 0.0 | 135 | 38.70 | 3 |
| Myatt Snider | 14 | 36 | 36 | 35 | 9 | 36 | 31.5 | -21 | 6 | 23 | -17 | 0 | 0.00 | 3 | 3.4 | 0 | 0.0 | 129 | 52.20 | 2 |
| Jesse Little | 18 | 20 | 34 | 36 | 7 | 30 | 25.8 | -18 | 13 | 22 | -9 | 0 | 0.00 | 0 | 1.4 | 0 | 0.0 | 122 | 48.00 | 1 |
| Colin Garrett | 39 | 37 | 37 | 37 | 29 | 39 | 37.0 | 2 | 9 | 9 | 0 | 0 | 0.00 | 0 | 0.0 | 0 | 0.0 | 111 | 35.30 | 1 |
| Landon Cassill | 38 | 38 | 38 | 38 | 33 | 38 | 37.3 | 0 | 3 | 2 | 1 | 0 | 0.00 | 0 | 0.0 | 0 | 0.0 | 35 | 26.30 | 1 |
| Stephen Leicht | 37 | 39 | 39 | 39 | 37 | 39 | 39.0 | -2 | 0 | 0 | 0 | 0 | 0.00 | 0 | 0.0 | 0 | 0.0 | 1 | 23.20 | 1 |